Pregnancy sugar curve
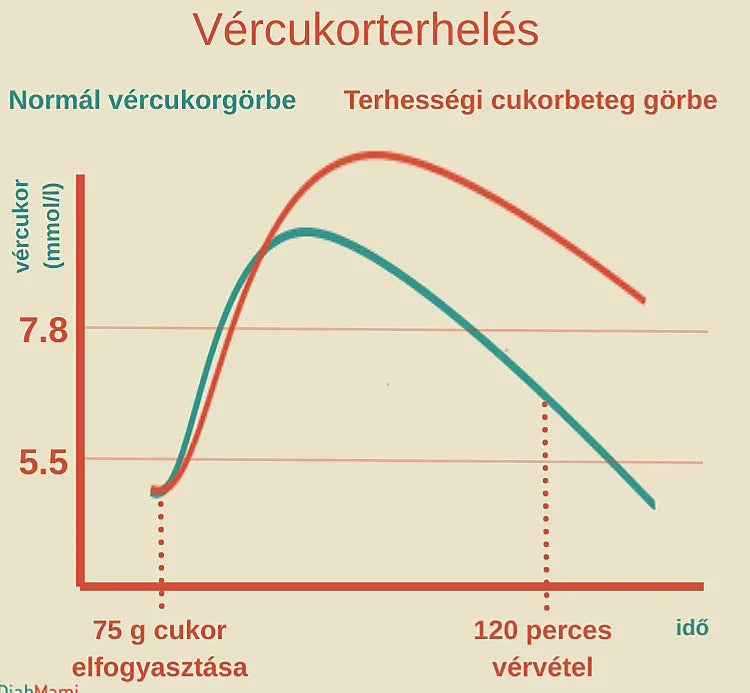
Allulose StoreThe pregnancy glucose curve diagram shows the results of the oral glucose tolerance test (OGTT) used to diagnose gestational diabetes, comparing the development of normal and gestational diabetes-specific blood sugar levels.
Inspection trip
The expectant mother consumes 75 g of glucose, and then blood sugar levels are measured first on an empty stomach and then 120 minutes later.
Normal curve (green)
Blood sugar levels rise after consuming glucose, but return to a healthy, normal range relatively quickly – around 120 minutes.
This indicates that insulin response and glucose utilization are adequate.
Gestational diabetes curve (red)
Blood sugar levels will be higher after the glucose load and will still be elevated at the 120-minute measurement, not returning to normal levels.
This refers to the delayed or insufficient insulin response and insulin resistance that are characteristic of gestational diabetes.
Limit values
Values around 5.5 mmol/l and 7.8 mmol/l indicate the border between normal and abnormal values.
For example, a fasting blood sugar level below 5.5 mmol/l may be healthy, while a value above 7.8 mmol/l measured 2 hours after exercise may indicate risk.
The role of insulin resistance
The main mechanism of gestational diabetes is insulin resistance , when cells become less responsive to insulin, so the body produces more insulin, but it is not effective enough to keep blood sugar levels normal.
In summary
The image clearly illustrates that in gestational diabetes, the increase in blood sugar levels is greater and more persistent, and decreases more slowly than normal, which can be attributed to the reduced effectiveness of insulin.
This is an important diagnostic basis in pregnancy care to identify and treat the problem in a timely manner.
.

