Blood sugar curve
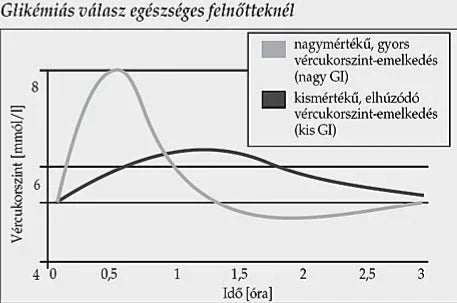
Allulose StoreThe graph shows how the body of healthy adults reacts after consuming foods with different glycemic indexes (GI):
High GI food
The gray curve depicts a sharp, rapid rise in blood sugar levels, which reaches a peak (above 8 mmol/l) after about 0.7 hours.
Then the blood sugar level drops rapidly and may drop below the original value after 2.5–3 hours.
This is typical of high-GI, rapidly absorbed carbohydrates (e.g. white bread, sugary soft drinks).
Low GI food
The black curve shows a slower, more moderate rise in blood sugar levels, which peaks after 1–1.5 hours (at approximately 6.5 mmol/l), and then slowly and gradually returns to baseline levels.
This is typical of low-GI, slowly absorbed carbohydrates (e.g. whole grains, legumes).
Essence
High-GI foods cause rapid blood sugar fluctuations, while low-GI foods result in more even, stable blood sugar levels, which is more beneficial for the body in the long run.

