Fat burning heart rate
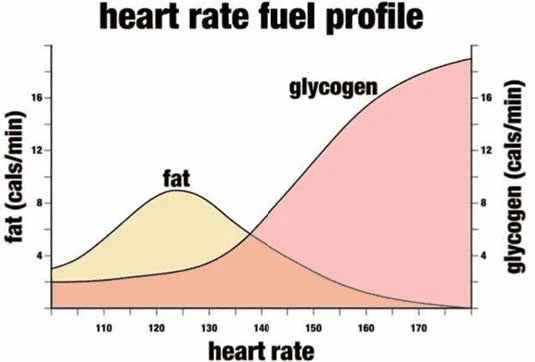
Allulose StoreThe image depicts a “heart rate fuel profile” graph, which shows the relationship between heart rate (horizontal axis) and the use of energy sources (fat and glycogen, vertical axis).
Fat burning
Fat burning increases as heart rate increases, then peaks at a certain point (around a heart rate of 120-130) and then decreases.
Glycogen utilization
Glycogen utilization increases continuously as heart rate increases, becoming especially dominant in higher heart rate ranges.
Crossroads
The curves for fat and glycogen utilization intersect, indicating the point where the use of one energy source becomes dominant over the other.
Heart rate zones
Based on the graph, it can be observed that fat burning dominates during lower intensity workouts, while glycogen utilization becomes dominant during higher intensity workouts.
Essence
The “heart rate fuel profile” graph illustrates how the ratio of energy sources used by the body (fat vs. glycogen) changes as a function of heart rate:
Fat burning
As the heart rate increases, fat burning also increases, reaching a maximum at a heart rate of approximately 120-130 , after which it gradually decreases.
Glycogen utilization
This energy source becomes more dominant as heart rate increases, especially during higher intensity (higher heart rate) workouts.
Intersection point
There is a point (usually around a heart rate of 120-130) where the rate of fat and glycogen utilization is equal, from here glycogen becomes the main energy source.
Heart rate zones
At lower intensities (lower heart rate), fat will be the dominant use, while at higher intensities (higher heart rate), glycogen will be the dominant use.

